
by Chris Kimble | Feb 16, 2016 | Kimble Charting
CLICK ON CHART TO ENLARGE Global stock markets have been creating a series of lower highs since May of last year. The decline has caused the Fear Index (VIX) to push higher since the summer of 2015. As you can see above, the VIX index has remained inside of falling...

by Chris Kimble | Feb 12, 2016 | Kimble Charting
CLICK ON CHART TO ENLARGE In May of last year, the S&P hit a key level and stopped on a dime. We applied Fibonacci tools to the highs in 2007 and the lows in 2009, to the chart above. The 161% Fibonacci extension level came into play in the 2,150 zone last year,...

by Chris Kimble | Feb 11, 2016 | Kimble Charting
The Power of the Pattern would describe a bull trend, based upon a series of higher lows and higher highs. Using this definition, the broadest of indices in the states, are “breaking 5-year rising trends!” This could break the heart of the bulls. CLICK ON...
by Chris Kimble | Feb 10, 2016 | Kimble Charting
When it comes to getting hit hard, the Dow Jones Transportation Index fits the bill over the past year. Few if any major indices have fallen harder, over the past 12-months. Below looks at the DJ Transportation Index/S&P 500 ratio over the past decade. The ratio...

by Chris Kimble | Feb 9, 2016 | Kimble Charting
CLICK ON CHART TO ENLARGE When assets reach prior highs, its time to pay attention from a Risk On & Risk Off basis. The chart on the left is Silver, going back to the mid 1970’s. As you can see it reached $50 in the early 1980’s and then quickly...
by Chris Kimble | Feb 8, 2016 | Kimble Charting, Metals
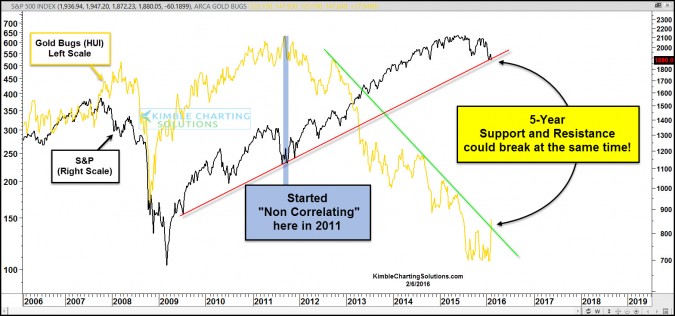
CLICK ON CHART TO ENLARGE S&P 500 has created a series of higher lows and higher highs for the past 5-years! Some would define this as a bull market. Gold Bugs Index (HUI) has created a series of lower highs and lower lows, for the past 5-years! Some would define...
by Chris Kimble | Feb 8, 2016 | Kimble Charting
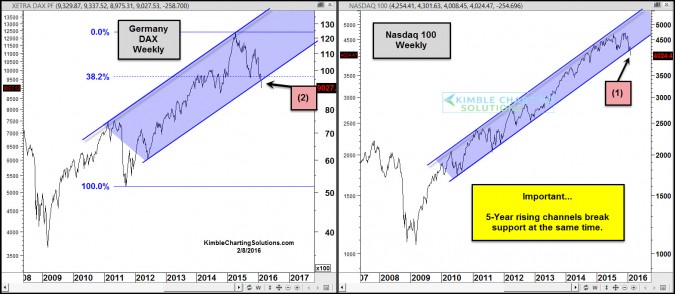
CLICK ON CHART TO ENLARGE Two leading indices, Nasdaq 100 and Germany (DAX), look to be doing something neither has done for the past 5-years. The Nasdaq 100 last week looks to have “closed below 5-year rising channel support” at (1) above. At the...

by Chris Kimble | Feb 5, 2016 | Kimble Charting
CLICK ON CHART TO ENLARGE S&P 500 tops in 2000 and 2007 took place 91 one months apart. Did another top take place 91 months after the 2007 top. So far it looks very possible. If you double that time frame, you get 182 months. What is the odds that the NDX 100...
