
by Chris Kimble | Aug 15, 2014 | Kimble Charting
CLICK ON CHART TO ENLARGE Silver has lost almost two-thirds of its value over the past three years. This decline has Silver hitting a 10-year support line inside of a three year falling channel. Joe Friday….Very important that Silver holds at this...

by Chris Kimble | Jul 24, 2014 | Kimble Charting
CLICK ON CHART TO ENLARGE From the early 2000’s to 2011, Silver continued to create bullish “Ascending Triangles” as it rallied from $4 to $50, highlighted in green above. After peaking at $50, Silver has started creating the opposite...

by Chris Kimble | Jun 6, 2014 | Kimble Charting
CLICK ON CHART TO ENLARGE Are Gold & Silver still in a bull market? Some say yes, others say no, each person coming from a different point of view. If one uses long-term support lines (10 years+) as a gauge, the bull markets are still in place in both...

by Chris Kimble | May 12, 2014 | Kimble Charting
CLICK ON CHART TO ENLARGE Three years ago this month Silver was hitting it’s 1980’s high, reflected in the chart below. Around the same time, Gold was becoming a crowded trade, so crowded the Gold ETF (GLD) became the largest ETF in the world!...

by Chris Kimble | Apr 15, 2014 | Kimble Charting
CLICK ON CHART TO ENLARGE Silver is facing a key support channel at (3) in the chart above, that if it fails to hold, could usher in selling pressure and much lower prices. I have been sharing a price for Silver with Premium and metals members that I am...
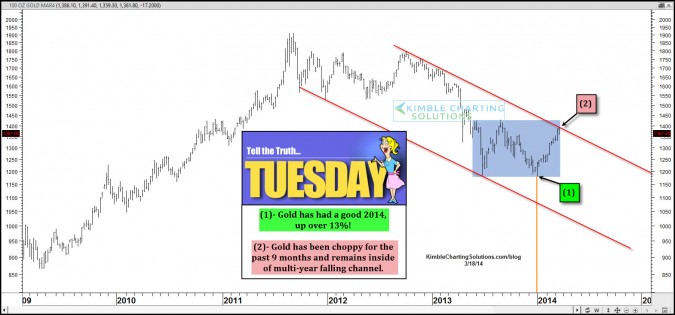
by Chris Kimble | Mar 18, 2014 | Kimble Charting
CLICK ON CHART TO ENLARGE 2014 has been kind to Gold, as its up over 13% in less than 90 days. What has this rally proven when it comes to the big picture for Gold? The above chart reflects that in the past 9-months, gold looks to be chopping back and forth. In...

by Chris Kimble | Mar 7, 2014 | Kimble Charting
CLICK ON CHART TO ENLARGE I shared the above chart three weeks ago with members…suggesting to “Rent Rallies in Silver, not own them!” Why Rent? The above long term chart focuses on “Ascending and Descending Triangles” in...

by Chris Kimble | Jan 17, 2014 | Kimble Charting
CLICK ON CHART TO ENLARGE What a difference 30-months can make! 30-Months ago the Power of the Pattern shared that Gold could be flat to down for years to come (see post here) Its not been too pretty for metals since that time frame, as Gold has lost one...
